
Research results
Turn observations into a report that helps your team make decisions.

Research results
How to write a report your team can act on
After the data has been processed and the conclusions have been formulated, it is time to apply the insights in practice:
- Document the results. You should be able to return to the findings — to reuse them, grow your knowledge base about users, and remember which product decisions were based on them. Choose a suitable format: mature teams usually have a report library, while for quick tests it may be enough to document findings directly in the Figma project. The main thing is to give colleagues access and keep everything in a shared workspace.
- Share the findings with the team. The format depends on the scale of the study and the team culture: it may be a presentation, a short messenger post, or an update in Confluence. The goal is the same: interested colleagues and requesters should be able to use the insights in their work and understand what data informed the decisions.
- Define the next steps. What decisions need to be made based on the results: change the interface, choose a direction, approve a release? If it is a small unmoderated test, the decision can be made immediately. If the study is complex and strategic, bring the team together to discuss the next steps.
- Move to action. Once the direction is chosen, the key stage begins: implementing changes based on user data. Each team member takes responsibility for their own part of the work.
- Evaluate the effect. After changes are implemented, analyze their impact on key metrics. This step shows the real value of research and helps adjust the approach if the result is below expectations.
Below, we will discuss what to do when you need deeper work with research results. This may be the case if:
- You ran a large discovery study with many hypotheses and many insights
- You are building a user knowledge base and it is important to document research findings in a structured way
- The findings have strategic importance and major product-wide decisions must be made based on them
- You work in a research team whose job is not only to quickly validate interface decisions, but also to help the product develop based on user experience overall.
Writing the ideal report
The most important thing is that the research artifact directly answers the hypotheses and questions set at the beginning. To avoid missing anything, open the briefing notes or the hypothesis document and cover each point in the report one by one.
A report can be prepared in any convenient format: slides, a Confluence or Notion page, or an online board. The main thing is to follow general structure principles. The most important ones are:
- What you did: the study type and what was researched — this can also be reflected in the title
- When: this can also be reflected in the title — it helps readers understand how current the study is
- Why: describe the business problem, context, study goal, and hypotheses
- What materials were tested: links to prototypes, clear screenshots of the interface when describing issues
- Key findings and recommendations: place them at the beginning so the reader can quickly understand the main results
- The main detail block with observations: it can be grouped by the hypotheses you tested
- Next steps: what will happen next with the research results — this block can and should be updated after the results presentation
An example report structure:
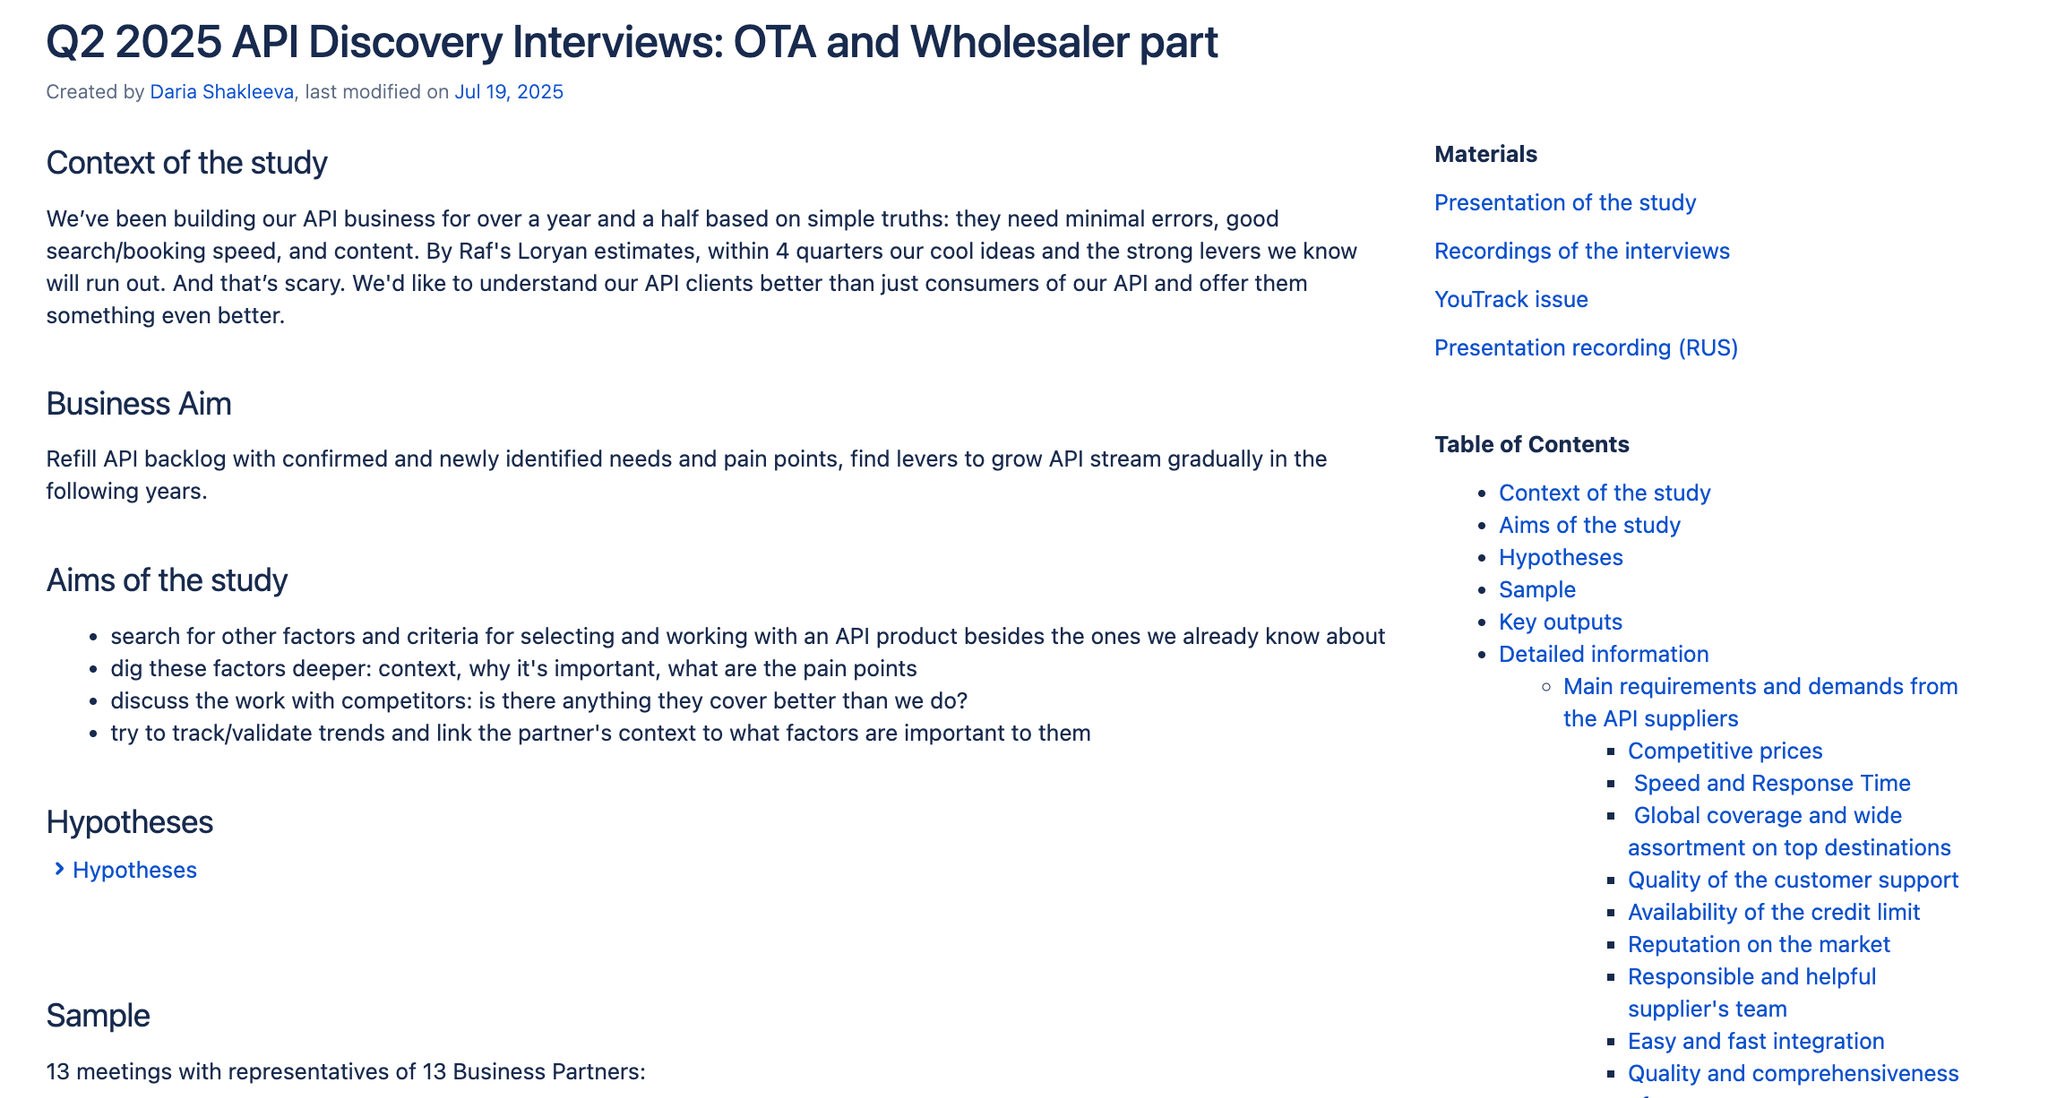
Q2 2025 API… — Date / Month of the study + Title
Context of the study
Business Aim
Aims of the study
Hypotheses — hypotheses and research questions
Sample
Key outputs (not in the image, but make it a block slightly larger than Aims of the study) — key findings
Detailed information (not in the image, but make it the largest block on the page)
What’s next (not in the image, but make it a block slightly larger than Aims of the study) — next steps
In the right column:
Materials, including: research presentation, interview recordings (in our version, this can be replaced with “raw data”), tracker task, recording of the research presentation
Table of contents
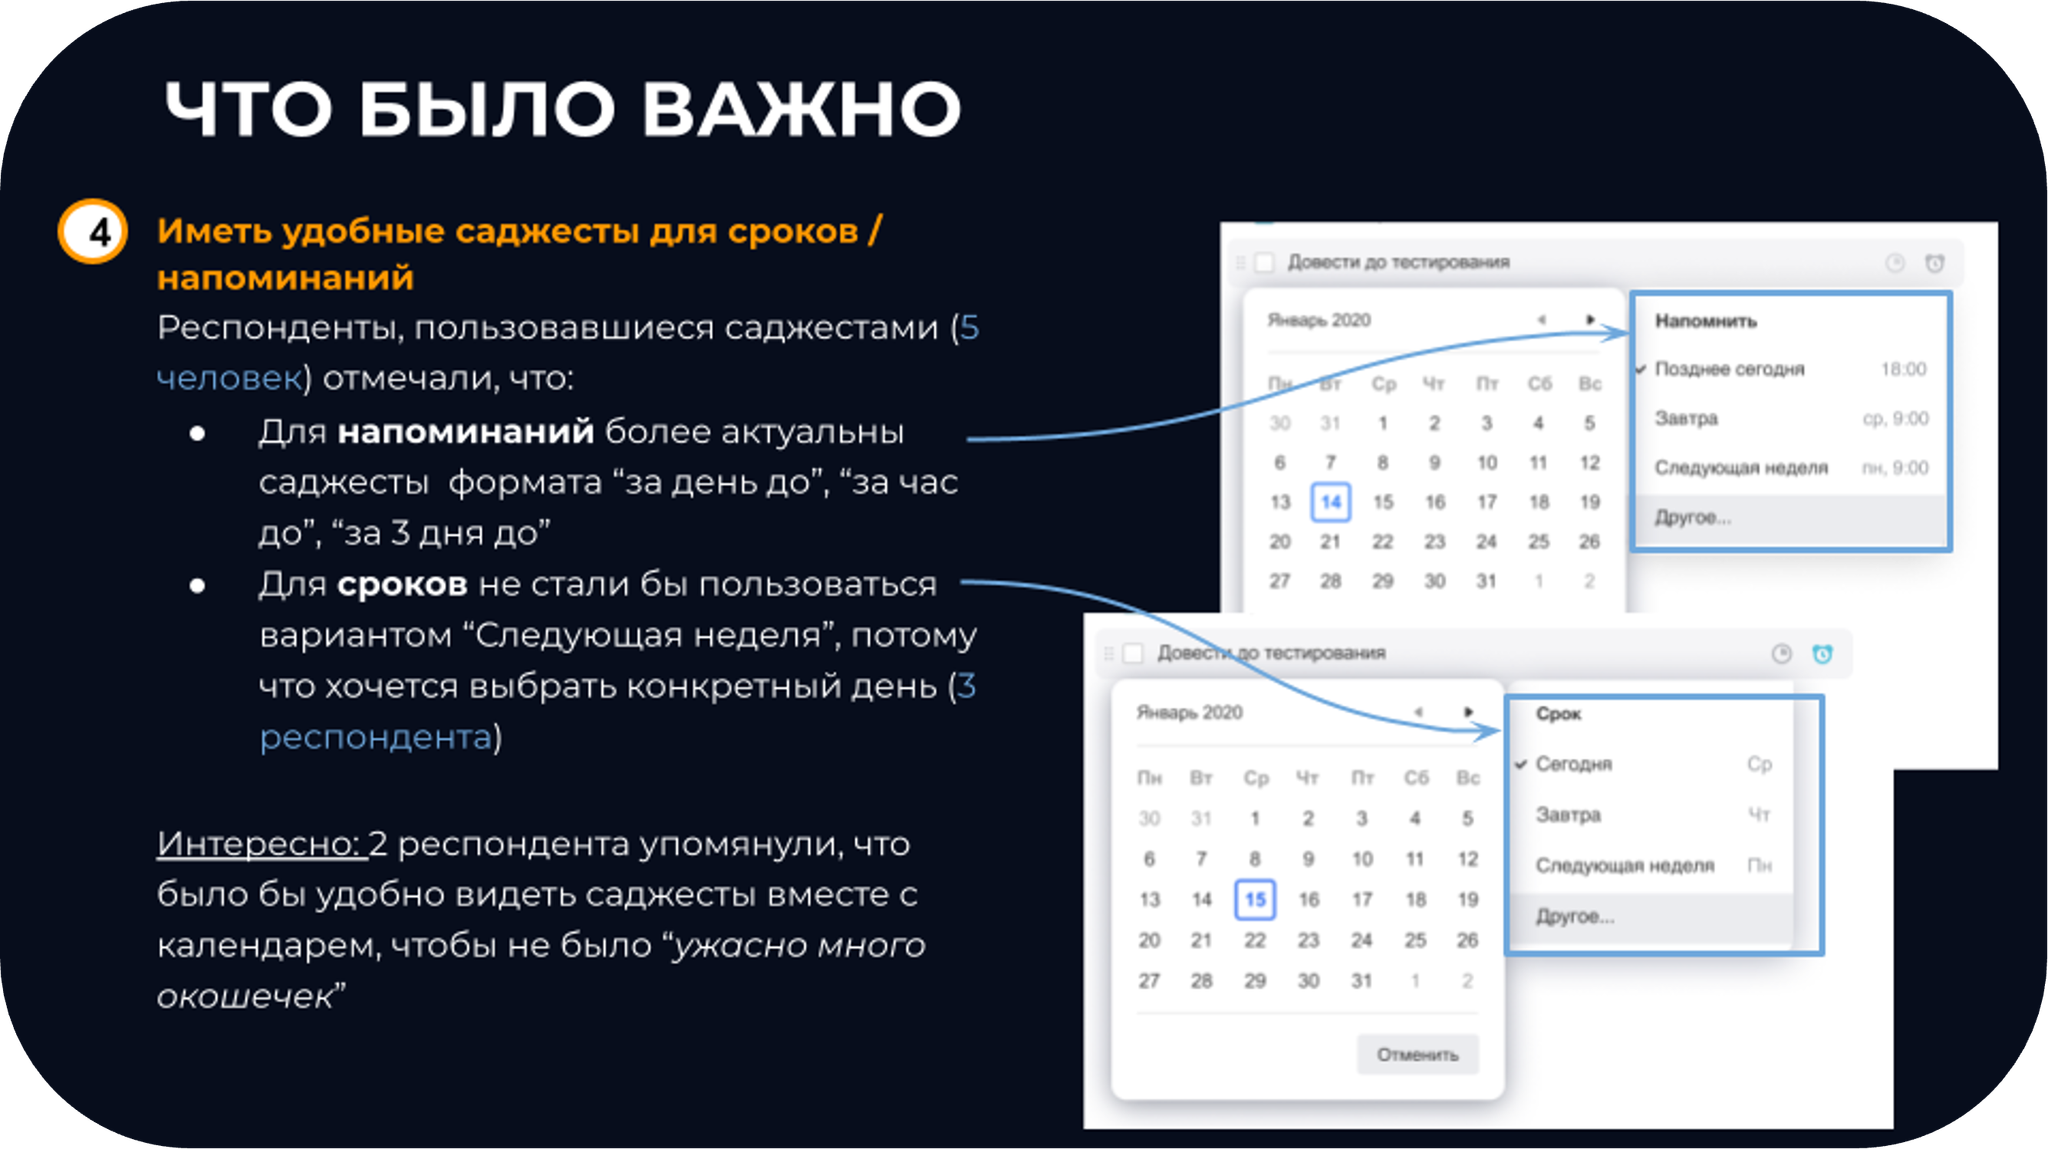
When describing interface issues, be sure to show the interface itself, the problem area, and describe:
- What exactly happened (the essence of the issue)
- Issue severity
- How it appeared during the test
- Why this is a problem
Section title, for example Checkout page
Brief issue summary, for example “users do not understand where to click to place an order”
Issue severity (not shown in the screenshot, but write briefly, for example “High severity”; you can highlight it in red)
A block describing the issue, for example: 8 out of 30 users could not complete the target action, which was clicking the “Place order” button, and spent about two minutes on average trying to find it in the interface before giving up.
Why this is a problem, for example: this issue may reduce conversion to the target action, placing an order.
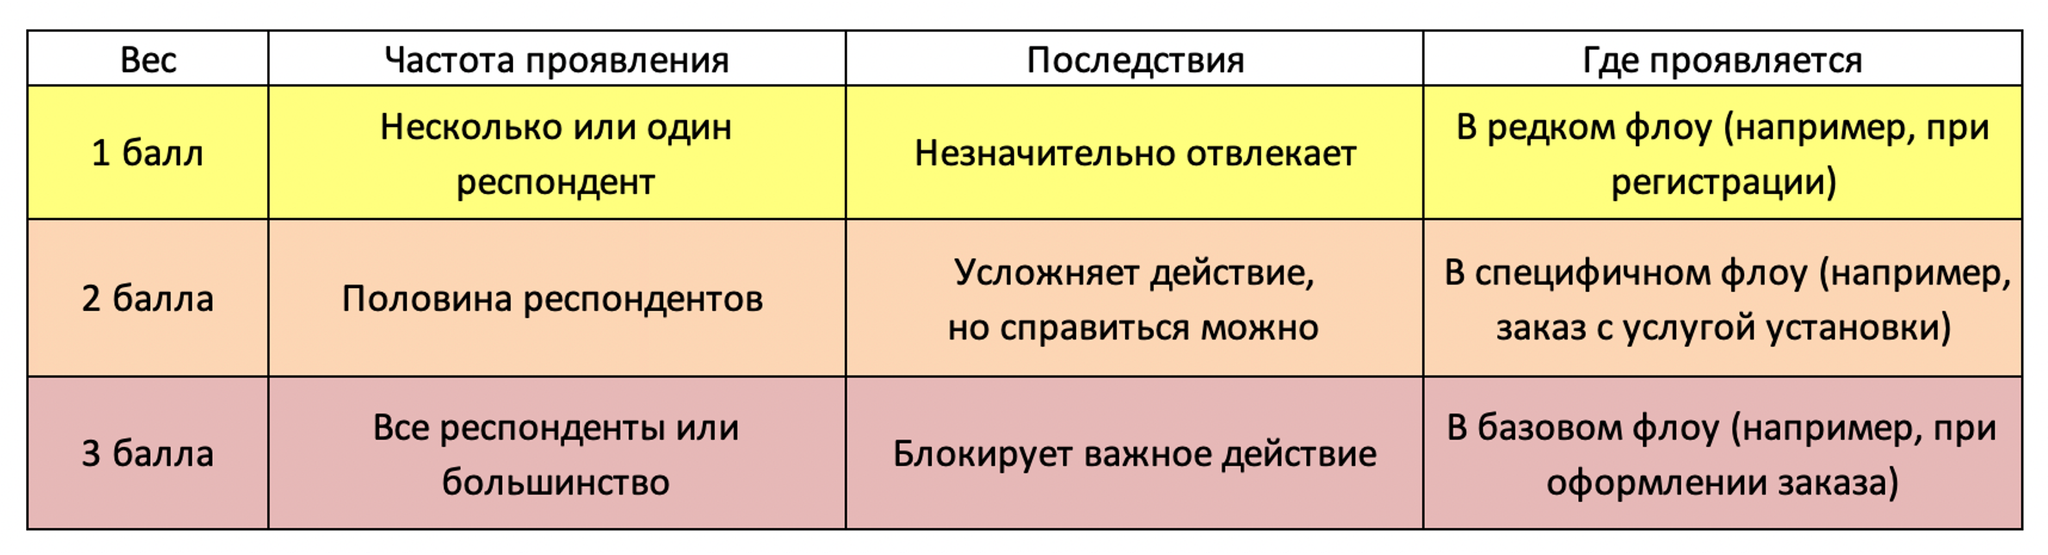
How to determine issue severity
The severity of a usability issue consists of three factors:
- Frequency: how many respondents encountered it? How many times in one test?
- Consequences: will users be able to handle it easily, or will the losses be significant?
- Where it appears, or persistence: will users encounter the issue once, or will it keep bothering them constantly?
A report is the main artifact, but not the only one produced by research. Depending on the situation, you may end up with about 7–9 useful project materials:
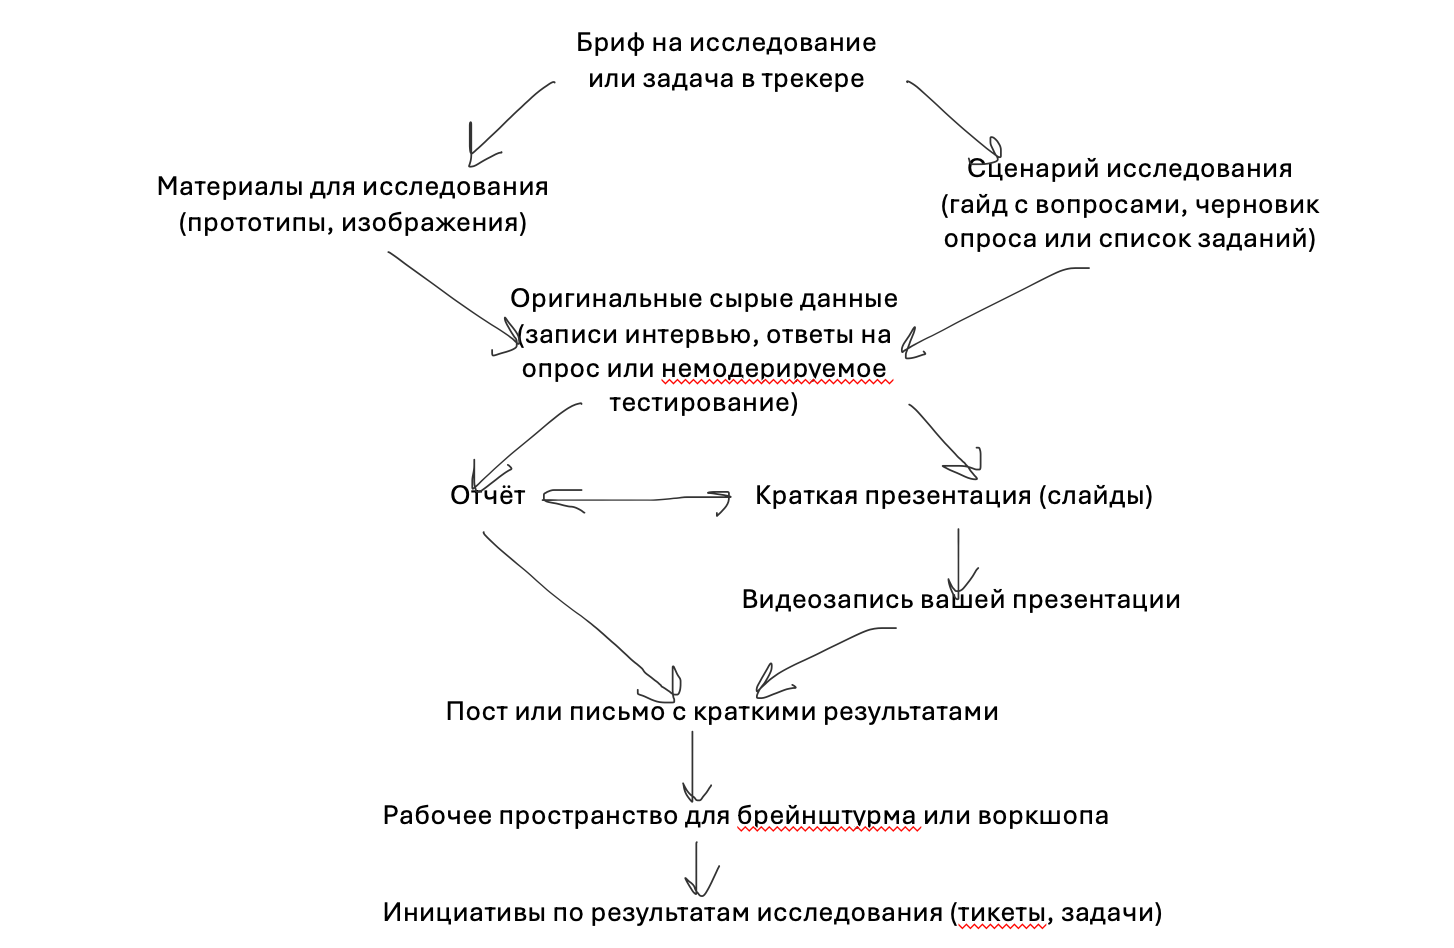
- Research brief / tracker task
- Research script: a guide with questions, a survey draft, or a task list
- Research materials: prototypes, images
- Original raw data: interview recordings, survey answers, or unmoderated test data
- Report
- Short presentation: slides
- Video recording of your presentation
- Post or email with brief results
- Workspace for brainstorming or a workshop
- Initiatives based on research results: tickets, tasks
When preparing the report, pay attention to linking these materials together and making it easy for the reader to access them. This will be useful both for understanding the study context and for you in the future, so you can quickly find and reuse existing artifacts or compare new data with them.
Results presentation
Depending on the timeline, the presentation can be held either before or after writing the detailed report. Sometimes a presentation with prepared slides can become both a way to share results and a reporting format.
The following steps will help the presentation achieve its goals and run smoothly:
Step 0 — Think about who should be present for the results discussion. In addition to requesters, adjacent teams and other colleagues may be interested in the study because your findings may affect them. To define the participant list, you can consult the study requester.
Step 1 — Start with the main point, then go into the details. Do not make listeners wait: state the main research findings right away, then explain what they mean. This will make it easier for meeting participants to understand what is happening and connect the results into a single picture.
Step 2 — Summarize and repeat the main points again. Human perception works in such a way that we remember best what we hear at the beginning and at the end. So at the end of your talk, briefly repeat the main findings.
Step 3 — Allow time for questions and discussion. A live discussion of the results will help you get valuable feedback on your study and immediately arrive at some ideas and initiatives based on the findings.
Step 4 — Plan the next steps. It is worth spending at least a little time documenting the next steps, even if it is only an agreement about when you will meet for the next discussion. This helps the team feel responsible for working with the results and facilitates implementation. You did not just listen and leave — you know exactly what you will do next and when.
Step 5 — Send a follow-up email or message. After the presentation, give colleagues a simple and clear path to the research materials and duplicate your agreements.
Disseminating results
The visibility of a researcher’s work is an important factor in developing UX culture in a company. Think carefully about how and where you should highlight your results:
- Identify the main touchpoints with stakeholders and the internal audience for your research, and bring the results there. These may be channels in the company messenger, regular syncs, or demo meetings. The more often colleagues hear about your projects, the more people will have access to useful data at the moment of important decisions.
- Publish results in a way that makes them easy to share. The easier it is to distribute findings, the further they will travel. Use a short post with a link to the full report, cards with the main insights, and definitely publish them in channels open to most colleagues.
- Plan publication so that the results appear where they are relevant. If the project you researched has a root document or a tracker task, it is useful to add a link to the results there. If you ran several related or sequential studies, make sure it is possible to move from one to another.
Implementing results
You can and should participate in implementing recommendations in the product and facilitate that work:
- Run a workshop based on the research results. To help the team decompose, understand, and apply the findings, a workshop or brainstorming session based on a template you prepared may be useful. Its goal is to outline the next steps or product improvement initiatives based on research data.
- Track the implementation status of recommendations. Set a control deadline — either separately for each project or a standard one for all — after which you return to the project owner for updates on whether your recommendations have been taken into work. This is one of the most labor-intensive processes and is not easy to set up, but it will raise your understanding of research impact on the product to a new level. You will be able to analyze which types of research are most applicable in practice, which ones produce meaningful impact, and which ones end up in a drawer. This understanding becomes the basis for improving the effectiveness of your work.
In Ostrovok’s B2B research direction, we introduced a regular process for evaluating the impact of research projects on the product. Once a quarter, we meet and discuss whether recommendations from studies completed in the previous quarter were taken into work. If we learn that the recommendations were developed and taken into account, we document exactly how and whether metrics increased as a result of the changes. This evaluation helps us see how research actually helps the product, analyze why some projects sometimes end up in a drawer, and improve the practical applicability of our recommendations.
- Become a “center of knowledge” about users. Your research should reach colleagues not only through texts and result publications, but also through your personal expertise. Take part in strategic planning and in work on the areas for which you ran tests and interviews. This will help protect the team from some mistakes and move forward more consciously.
AI in research: how it already helps
The rapid development of AI opens new opportunities to optimize processes in the UX researcher profession. Here are the main stages of research work where neural-network capabilities already save hours of routine work:
- Checking the business problem. A quick way to understand how well it is formulated and what else should be clarified with the stakeholder. GPT prompt for evaluating a business problem and generating clarifying questions for stakeholders. Insert your business problem into “Business problem for analysis.”
- Generating hypotheses. After formulating the main set of hypotheses during the project briefing with the requester, it is useful to ask a neural network to think with you about what else may be important to pay attention to during the study. The suggestions you get will complement the research focus and help you avoid missing nuances.
- Choosing a methodology. LLMs can help select a set of research methods for testing your hypotheses and determine the type of data that will best answer the research question.
- Searching for experimental data and research. Models with web search, such as Perplexity or newer GPT versions, can help find scientific articles or other research to support and strengthen your decisions.
- Adjusting wording in surveys and interview scripts. LLMs help come up with more elegant ways to ask a question, check grammar, shorten sentences, and adjust tone of voice.
- Analyzing open comments. With LLMs, you can analyze a large set of open comments, receiving ready-made findings or calculating the share of answers with certain keywords. Pathway offers this capability directly inside the platform when working with results analysis.
- Translating answers from another language. Microsoft Office add-ins, Gemini in Google Spreadsheets, and other tools remove the language barrier when analyzing open comments. You can translate texts into the target language with AI in a couple of minutes directly in your working document.
- Calculating data according to specified frameworks. Although neural networks are still not always flawless in data analysis, when given a calculation framework they can help calculate quantitative research results or analyze relationships in a dataset.
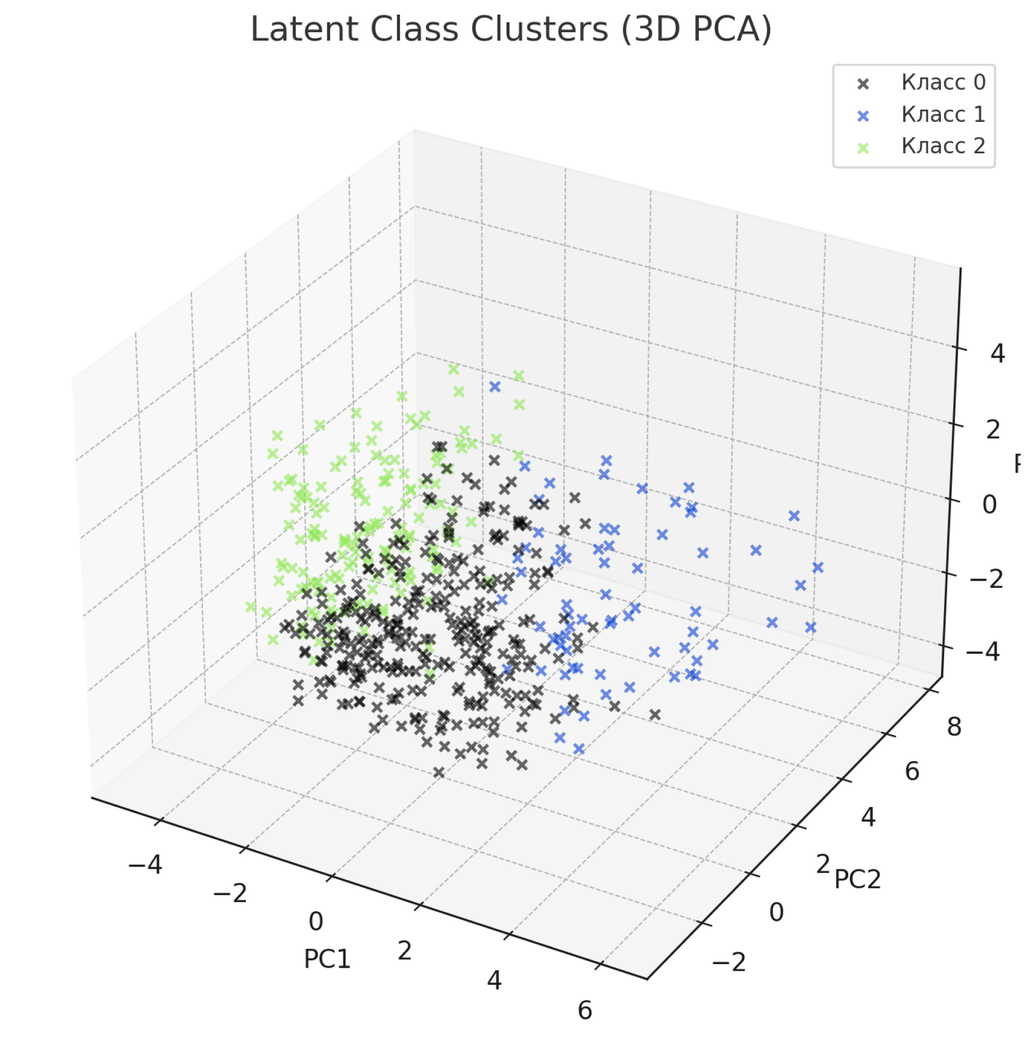
After running a survey on promo-code mechanics among users, I used ChatGPT for Latent Class Analysis to identify hidden behavioral characteristics that group users into segments, or classes. I also asked it to list metrics that could be used to judge the accuracy and reliability of the model, so I could make sure the results were trustworthy. ChatGPT described the discovered segments, highlighted how each differed from the others, and calculated each segment’s representation in the sample. As a result, we identified the segment that responds best to promos and adjusted our mailings so that promo codes are sent to the people whose decision can truly be influenced by their presence.
- Formulating conclusions. LLMs speed up data processing by helping interpret both quantitative and qualitative data. For example, tools such as Notebook LM or Breyta can help you find answers to research questions and formulate conclusions with specific quotes from interview transcripts.
- Creating personas based on collected data. Neural networks do fairly well at forming user personas based on findings and results that you have already formulated.
- Desk research and trend review. AI can help search for knowledge about current market trends and open data in your subject area. Perplexity and GPT’s “Search the web” feature are especially good at this.
- Searching the knowledge base. Modern insight repository tools, such as Dovetail, or custom AI implementation in local knowledge bases can greatly simplify the search for relevant insights on a topic.
We are constantly modifying our research knowledge base. As the number of researchers grew and the company split into business units, the insight base became too bulky and difficult to use. To make it easier to find answers to specific questions about users, we started testing a RAG (Retrieval-Augmented Generation) approach through Onyx, which connects to our Confluence. The model does not invent anything new; it extracts relevant fragments from the database and forms a connected answer with a link to the source. For us, this is a step toward turning the research base from an archive into a living decision-making tool.
New capabilities of research tools
In addition to well-known standalone products such as ChatGPT or Perplexity, many companies are integrating AI into their tools, making researchers’ lives significantly easier.
For example, Pathway can help you quickly review respondent answers with an AI summary or ask study participants follow-up questions based on the text they entered in an open-comment field.
SCREENSHOTS AND/OR LINKS

AI limitations
Despite their broad capabilities, AI tools are more practical to treat as junior colleagues. They are productive, but their suggestions and conclusions need to be checked, and their reasoning needs to be guided in the right direction.
Here are the main problems you may encounter and ways to neutralize them:
| Problem | Solution |
|---|---|
| Hallucination Many AI tools can invent conclusions even if you feed them specific interview transcripts or open comments. | — Use tools that provide links to specific quotes / numbers from your data so you can quickly check the basis for a conclusion, such as Notebook LM or Breyta — Require specific quotes from the transcript or links to data — Use prompts that define in advance the rules the neural network must follow, including direct instructions such as “do not invent anything” |
| Misinterpretation In a complex domain, a neural-network model may not understand field-specific nuances and may incorrectly interpret respondents’ words and comments | — Share materials on the topic with the neural network and ask it to interpret answers with the “learned” context in mind — Provide detailed context in the prompt, for example: “Our product offers API integration for hotel inventory”… |
| Incorrect calculations A request to calculate data using a specific framework, for example Price Sensitivity Meter, may fail — the model may use an invented calculation formula and give false results. | — Choose specialized tools for data analysis, such as specific GPT plugins — Provide the correct calculation formula and ask it to work strictly according to that formula |