
Research methods
Compare remote methods by the tasks they suit, how to set them up, and what data they produce.

Research methods
How to choose a method for your research question
At this stage, you already have a list of research questions and hypotheses. If not, read the chapter “Preparing for research.”
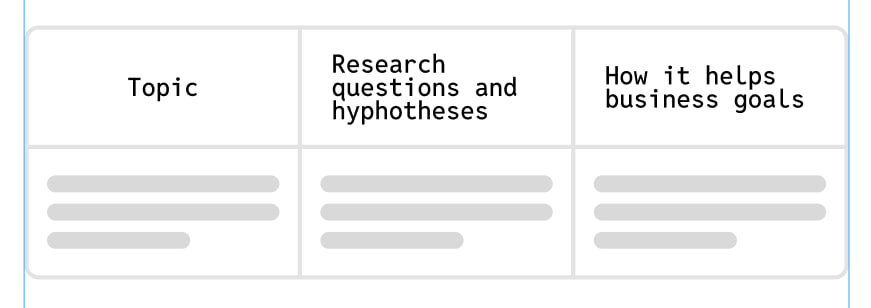
To choose the right method, match each question with one or more methods. This will give you a step-by-step plan and reduce the risk of missing something.
Do not limit yourself to the pattern “one question = one method.” Often, to get the full picture, it is worth checking one question in several ways.
| Method | How it works | Helps validate |
|---|---|---|
| Unmoderated Scenario-Based Test | the respondent completes a task in a prototype or on a website independently, without a moderator. For example: “Set up the order so it arrives by dinner.” | It shows whether users understand the interface, easily find the needed elements, complete the scenario without errors, and perceive the path as convenient. |
| Preference test | the respondent is shown several variants — screens, copy, or images — and asked to choose the one that seems better. For example: “Which option looks more beneficial?” | It helps understand the perception of different solutions, but not usability: which option inspires more trust and looks more attractive, which copy or banners attract more attention. |
| A/B usability test | respondents are shown different versions of the same screen or scenario — for example, variant A and variant B. Each group completes the same task, and you compare the results: who completed it faster, made fewer mistakes, and where users felt more confident. | The method helps determine which interface variant works better — not by taste, but by actual use. |
| Card sorting | the respondent is shown cards with product elements and asked to group them by meaning in the way they would expect to see them on a website or in an app. | It helps design navigation from scratch or check whether the current navigation matches users’ logic. |
| First Click | the respondent sees an interface screen and completes a task: find and click the element they would start with. | It helps understand whether the design is structured correctly and whether users understand where to click to solve the task. |
| Five-Second Test | the respondent is shown a screen or page for 5 seconds, sometimes longer if the content is complex, and then answers questions. | It helps evaluate the first impression of a page, screen, or product: what people notice immediately, whether they understand the meaning, and how clearly the brand or product message is communicated. |
Unmoderated scenario-based testing
The respondent completes a task in a prototype or on a website independently, without a moderator.
Scenario testing helps check: ✔︎ Whether users understand the interface and find the needed elements without hints. ✔︎ Whether they can complete the scenario on their own, in how many steps, and how much time it takes. ✔︎ Where errors, difficulties, or incorrect actions occur. ✔︎ Whether the path feels simple and convenient, and where users most often drop off.
Does not help check:
- It does not always answer “why” — the reasons for errors are only partly visible through the path or final comments.
What to consider when running it:
- The test takes 5–10 minutes; the optimal minimum is 15 respondents.
- The more complex the scenario and the more possible paths it has, the more sense it makes to run a moderated study.
- It is better to split the prototype into short tasks so the person does not get confused.
- Add a separate “success screen” to capture the result.
- The device used for the test should match the prototype.
- Consider privacy when setting up the test: not everyone is comfortable turning on a camera, and this can also affect completion conversion.
- The method does not always answer “why” — the reasons for errors are only partly visible through the path or final comments.
Preference test
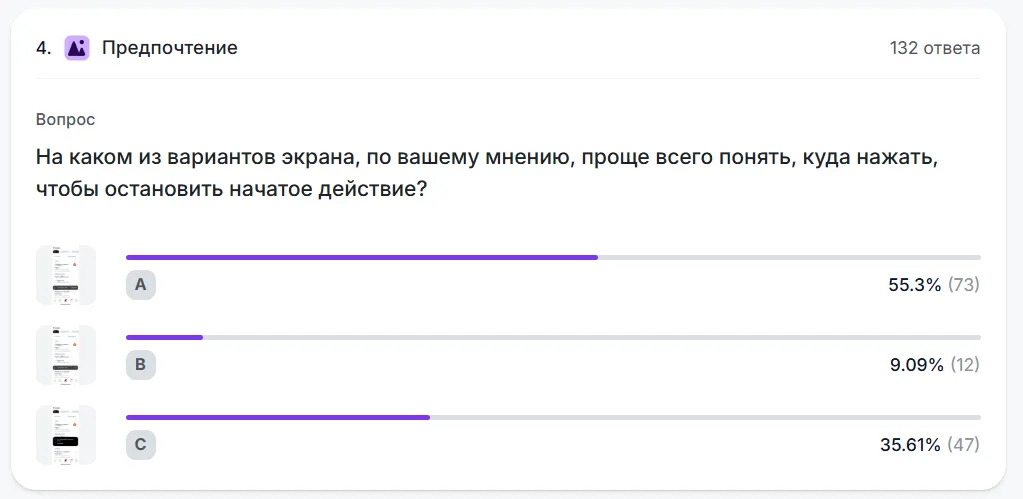
The respondent is shown several variants — screens, copy, or images — and asked to choose the one that seems better. For example: “Which option looks more beneficial?”
The method helps understand the perception of different solutions. It is not about usability, but about impressions: trust, emotional tone, attractiveness. For competitive products, these nuances become part of the strategy because they directly influence the sense of convenience and trust in the brand.
✔︎ Which option inspires more trust and looks more attractive. ✔︎ Which copy or banners attract more attention. ✔︎ Which icons or illustrations feel more appropriate for the product.
What to consider when using the method:
- Compare only one detail at a time. If the variants differ in too many ways, it will be impossible to understand what influenced the choice.
- The change should be noticeable, not cosmetic. It is better not to test close color shades, fonts, or button labels — the difference may be too subtle.
- Phrase the question so that it sets the comparison criterion — for example, “Which option feels more emotional?” or “Which one inspires more trust?”
- When analyzing results, report the response share for each variant and the confidence interval for the difference.
- Do not compare your own screens with other services. Differences in logic and style are too large, and the results will be incorrect.
- Remember that Preference tests and A/B tests provide different information. The first reflects subjective perception; the second reflects real behavior. The results may not match.
What results you will get:
- The percentage of people who selected each screen.
- Detailed respondent comments explaining why they chose one option or another.
How to identify the winning variant
Before running a comparison, choose the primary metric and define what difference would change your decision. After the test, report the observed difference between variants and its confidence interval. Report differences in proportions, such as first-click success rates, in percentage points. Report differences in means in the metric’s own units, such as seconds. If the interval includes both a meaningful improvement and no effect, the data are still inconclusive. Whether the finding generalizes to the wider audience depends on who was recruited and how.
A/B usability test
Respondents are shown different versions of the same screen or scenario — for example, variant A and variant B. Each group completes the same task, and you compare the results: who completed it faster, made fewer mistakes, and where users felt more confident.
The method helps determine which interface variant works better — not by taste, but by actual use.
For example:
✔︎ Which page version helps users complete the scenario faster. ✔︎ Which button layout reduces errors. ✔︎ Which option generates more conversions.
How it differs from a preference test:
In an A/B test, people perform a task and you measure effectiveness. In a preference test, users simply choose which option they like visually or which one seems clearer.
What to consider when using the method
For reliable results, it is better to recruit enough respondents in each group. We explain how to calculate the required number of respondents in the chapter “How many respondents you need for quantitative research.”
Sample size for quantitative research

Card sorting
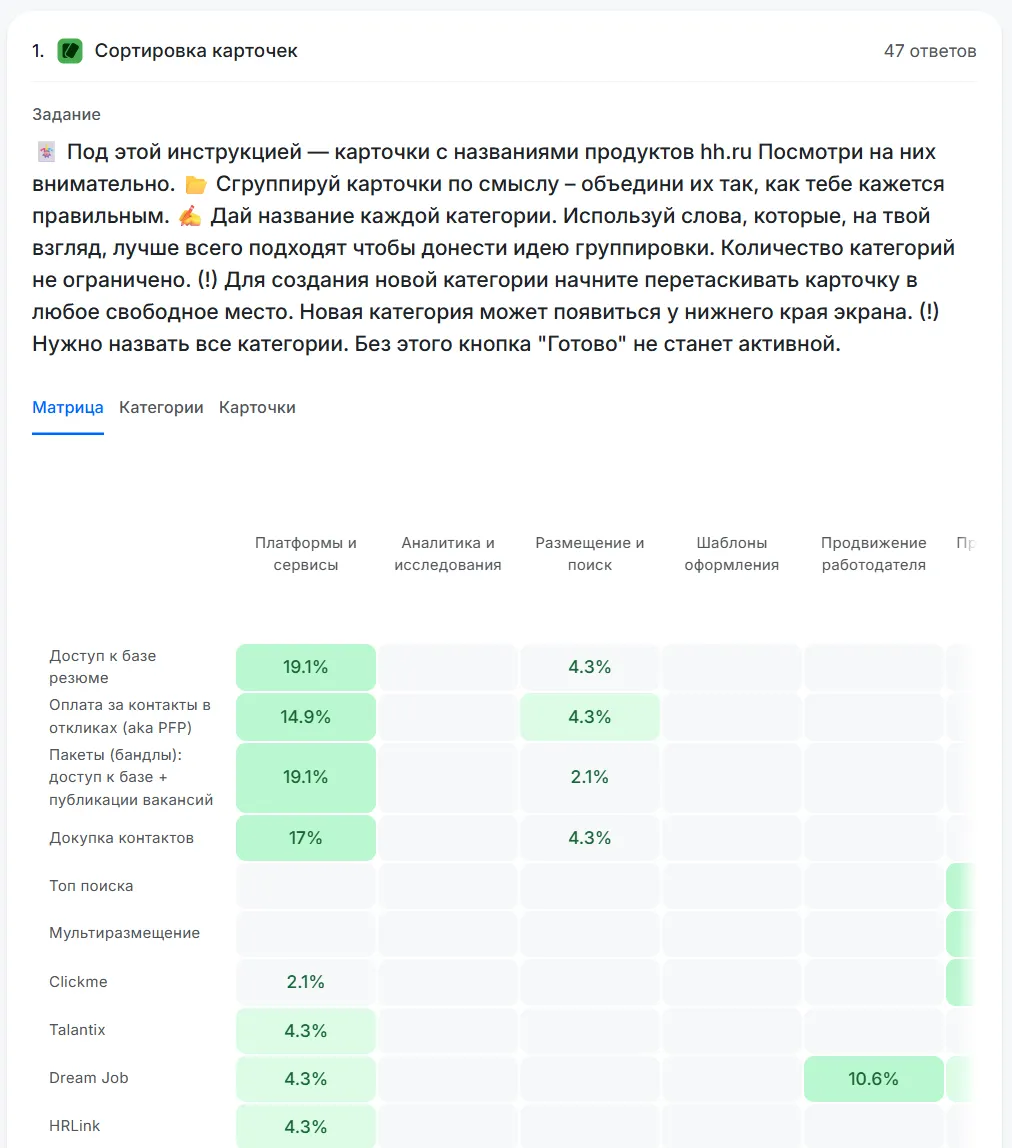
The respondent is shown cards with product elements and asked to group them by meaning in the way they would expect to see them on a website or in an app.
- In closed sorting, the groups are predefined.
- In open sorting, respondents create the groups and their names themselves.
The method helps not only design a structure from scratch, but also check how well the existing navigation matches the way users group information:
✔︎ How well do product navigation and structure match users’ logic?
✔︎ Which categories or sections should be merged or renamed?
✔︎ What is the best way to organize catalog and menu navigation?
✔︎ Which elements are difficult to place?
What to consider when using the method:
- Sorting does not give you a ready final menu — you need to analyze the grouping logic, find patterns, and only then build the structure.
- Number of cards: 30–50 is optimal. If there are too many cards, respondents get tired.
- Run it with several people: one result will not tell you anything, but with 20–30 participants stable patterns will appear.
What results you will get:
- For open sorting: catalog categories or menu items identified by respondents.
- For closed sorting: the distribution of elements across groups made by respondents.
First Click
The respondent sees an interface screen and completes a task: find and click the element they would start with. The method shows whether the design is structured correctly and whether users understand where to click to solve their task, for example: ✔︎ How easy it is to find an element on the page. ✔︎ How respondents use navigation, for example to understand which menu item people look in for the needed action. ✔︎ How effective the menu is, for example whether the respondent can find a specific product in it.
What to consider when using the method:
- Do not use button names or menu item labels in questions. Where would you click to pay? Imagine you want to buy this product. What would you do?
- When comparing screens, estimate the difference in your chosen metric and its confidence interval.
What to consider before drawing conclusions
- Add comments to clicks. Ask “Why did you click exactly here?” — this helps understand motivation and hidden logic that is not visible on the click map.
- Evaluate choice speed. It matters not only where people clicked, but also how quickly. Long hesitation may indicate doubts or an interface problem.
What results you will get:
- The main metric: the percentage of users who made the correct first click.
- Additionally, you can look at where people clicked incorrectly and which elements competed for attention.
Five seconds
The respondent is shown a screen or page for 5 seconds, sometimes longer if the content is complex, and then answers questions. The method helps understand:
✔︎ What first impression the page creates. ✔︎ Which elements users notice immediately. ✔︎ How they understand the meaning and purpose of the page or product. ✔︎ How clearly the message is communicated and whether it matches brand expectations.

What to consider when using the method:
- Do not hint at what exactly people should notice or remember.
- Do not tell respondents in advance that the screen will be shown for only 5 seconds — simply limit the display time.
- After the display, ask 1–3 open questions, for example: What do you remember from this page? What do you think this product, website, or screen is? What did you like or, on the contrary, find confusing?
- If the interface contains a lot of text or many elements, increase the time to 10–20 seconds to keep a balance between first impression and understanding.
- To compare different design versions, for example two landing pages, a Preference test is a better fit.
What results you will get:
- Qualitative answers: what people remembered, how they described the page in their own words, and what emotions they felt.
- Quantitative data: the share of participants who correctly identified the page goal, noticed key elements, or mentioned the brand.
Other methods that help measure opinion, attitude, satisfaction, and experience
Above, we covered the main unmoderated research methods. In many of them, after scenarios or tasks, you can add multiple-choice questions, satisfaction scales, or open questions to understand what people felt and thought.
Before the study begins, you can also learn about the respondent’s experience to interpret the results correctly: whether the person has used the product, faced similar tasks, or belongs to the target audience.
The same question types can also be used in separate surveys when you are not testing an interface but want to collect users’ opinions or experience.
Scale
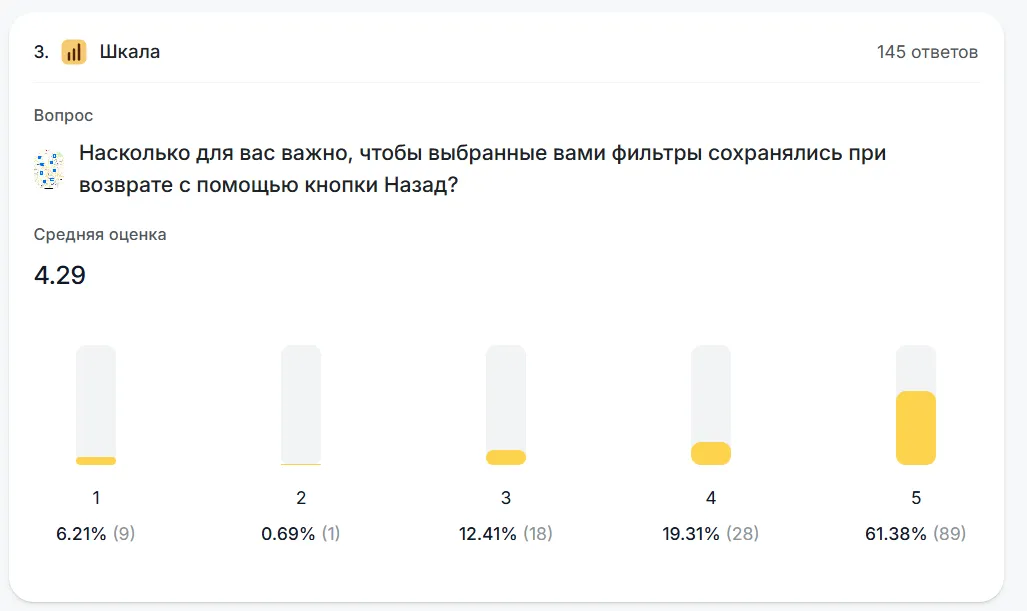
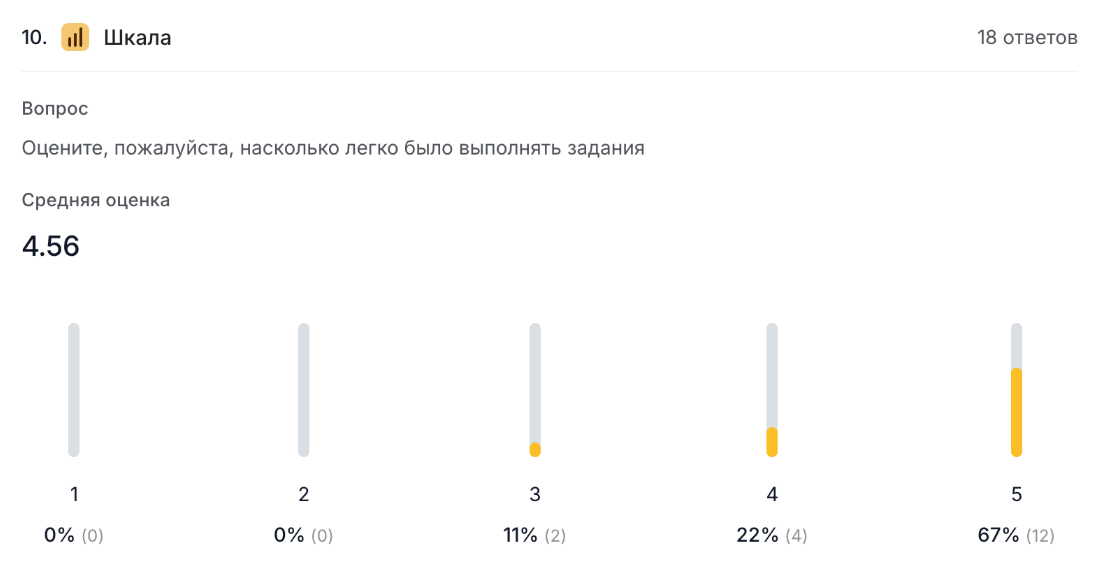
The respondent evaluates an object or experience on a scale — numeric, emoji-based, or star-based. The method helps measure subjective perception: satisfaction, importance, or ease of use, for example:
✔︎ How easy was it to complete the task? ✔︎ How do users rate the importance of factors, such as delivery speed? ✔︎ Satisfaction level with the product or a specific feature. ✔︎ Impressions of the interface and emotions while using it.

What to consider when using the method:
- The optimal scale length is 5 or 7 points.
- Many scales in a row tire respondents.
- Labels are required — without them, people interpret numbers differently.
- A scale shows subjective opinion, not actual behavior.
- For serious research, such as satisfaction, importance of factors, CSI, or NPS, it is better to use numeric scales. Emoji can be left for quick reactions or “light surveys,” where engagement is more important than precise data.
What results you will get:
- Average score
- Overall statistics
Matrix
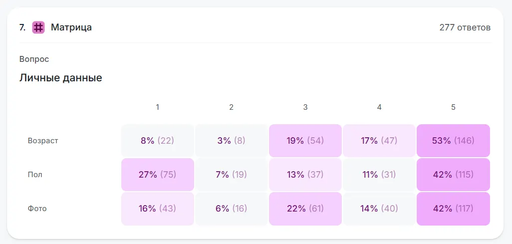
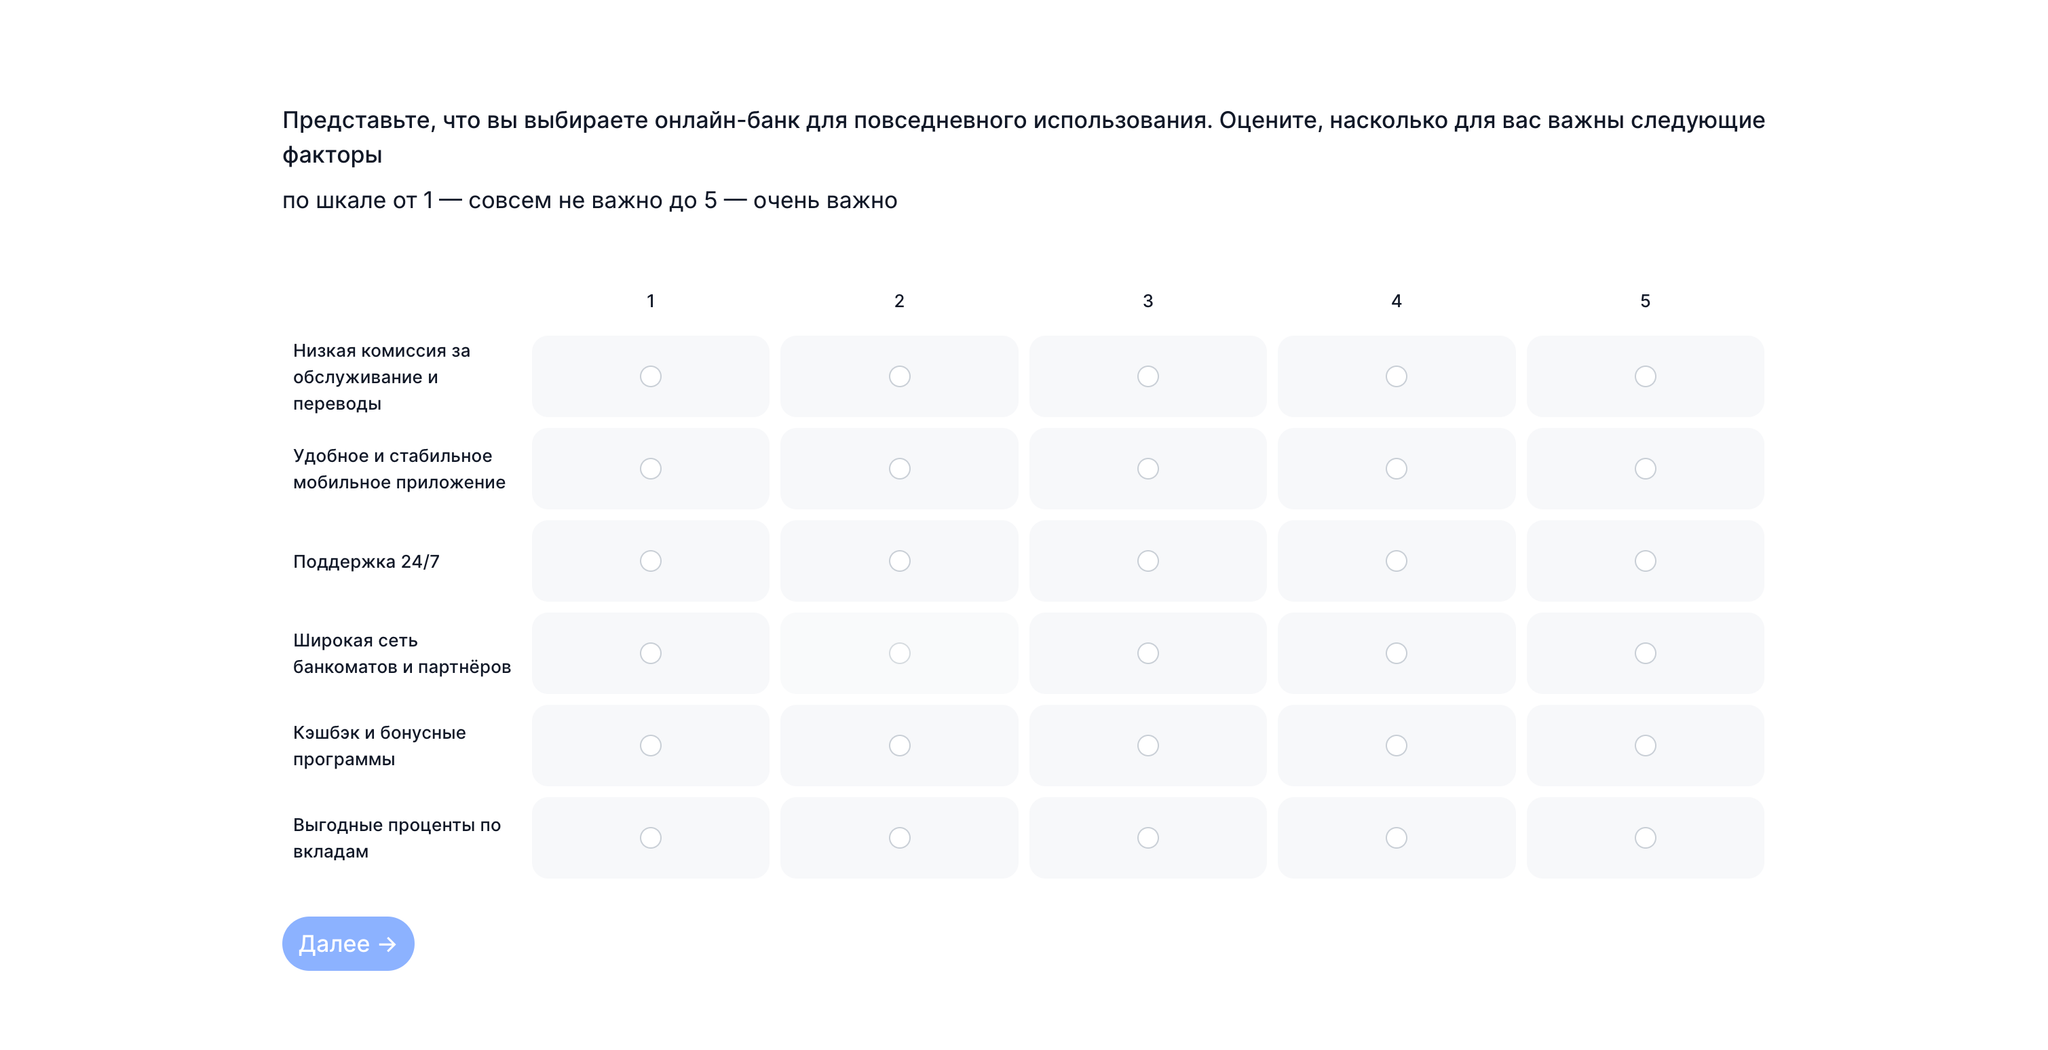
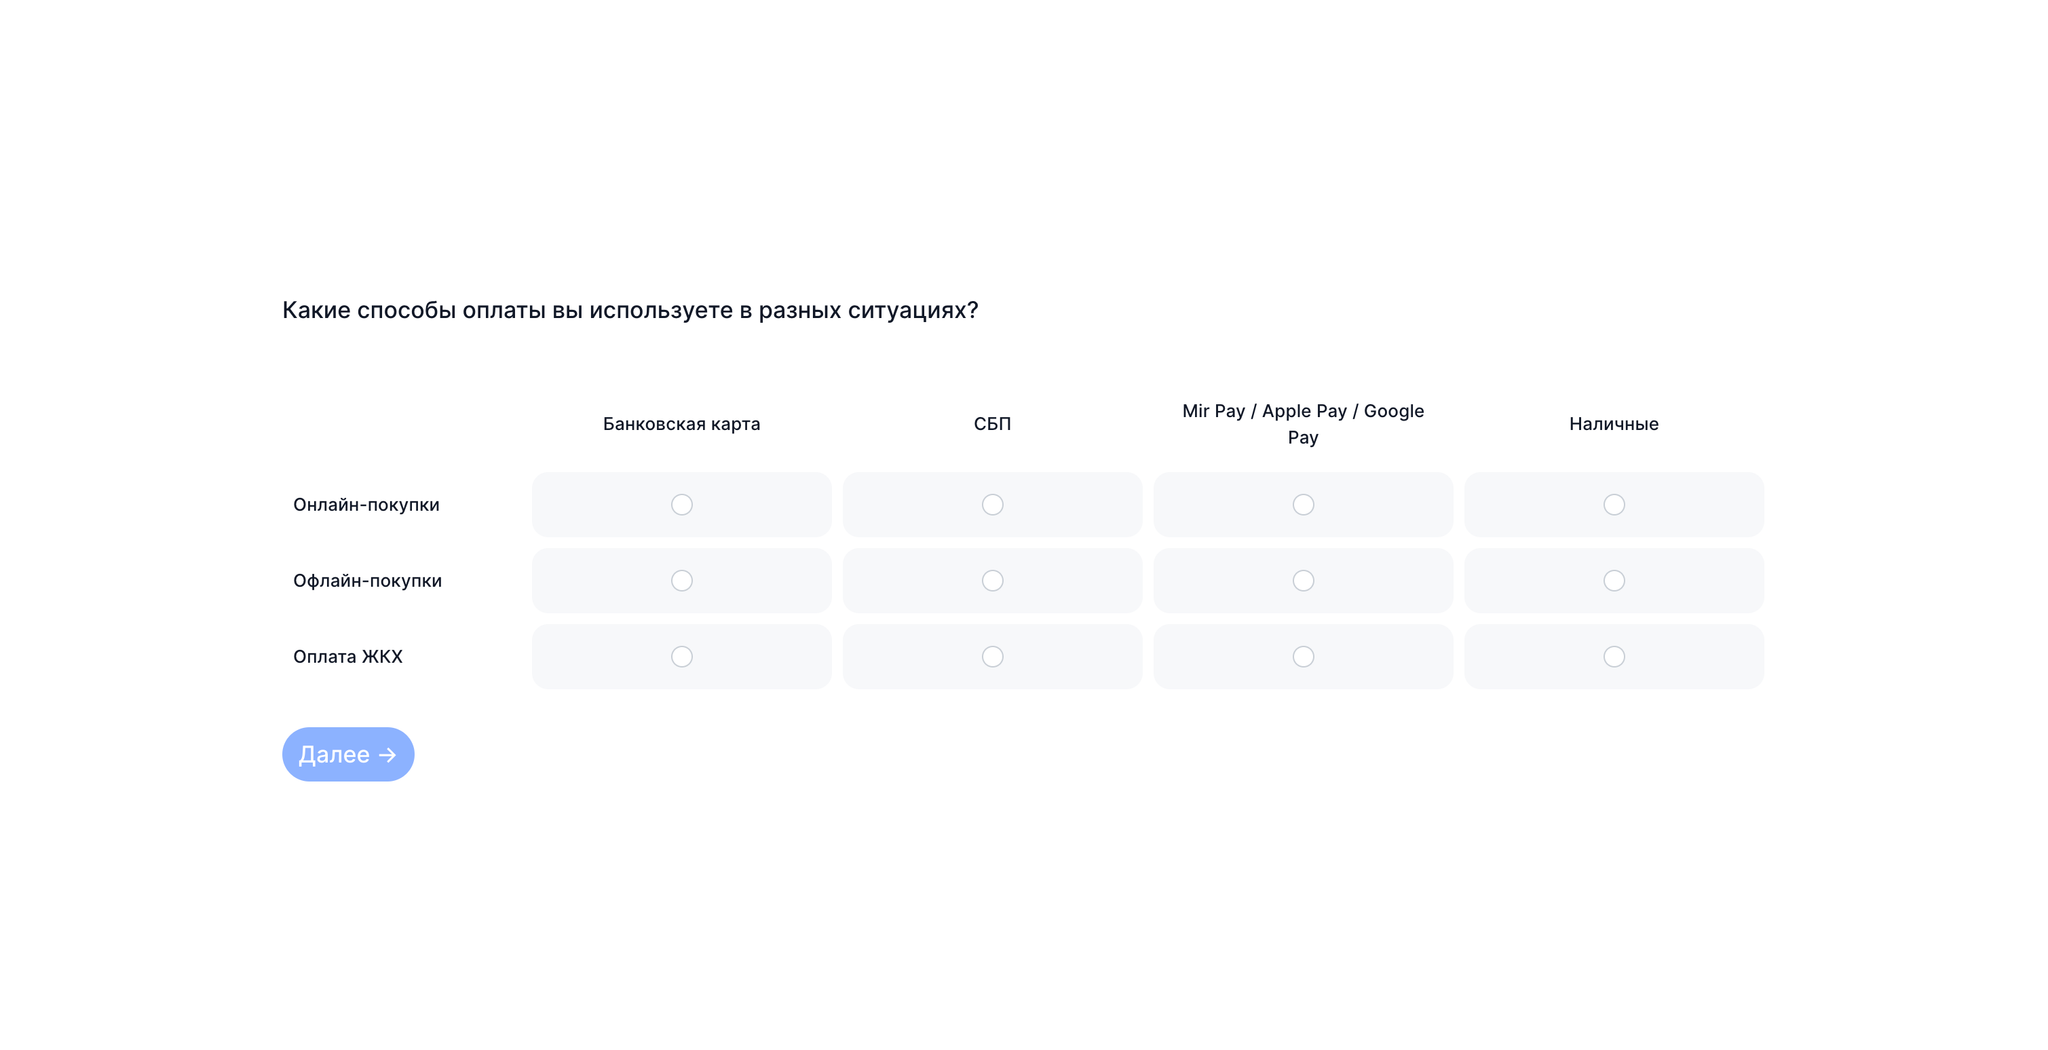
The respondent evaluates several factors at once on a scale, for example from “not important at all” to “very important” or from “poor” to “excellent.”
The method helps compare several parameters at the same time and see what matters most to users. For example:
✔︎ Which product characteristics influence choice the most? ✔︎ How well does the product perform different tasks, such as speed, simplicity, and reliability? ✔︎ How do users rate different aspects of the experience: navigation, visual style, loading speed?
What to consider when using the method:
- Do not overload the question: 5–10 factors is optimal.
- Make sure factor wording is clear and does not overlap.
- Use the same scale for comparison.
- The method does not explain “why” — for that, you need interviews.
- Compare the means directly. Report the difference in scale units and the confidence interval for that difference.
What results you will get:
- Factor ranking
Open question
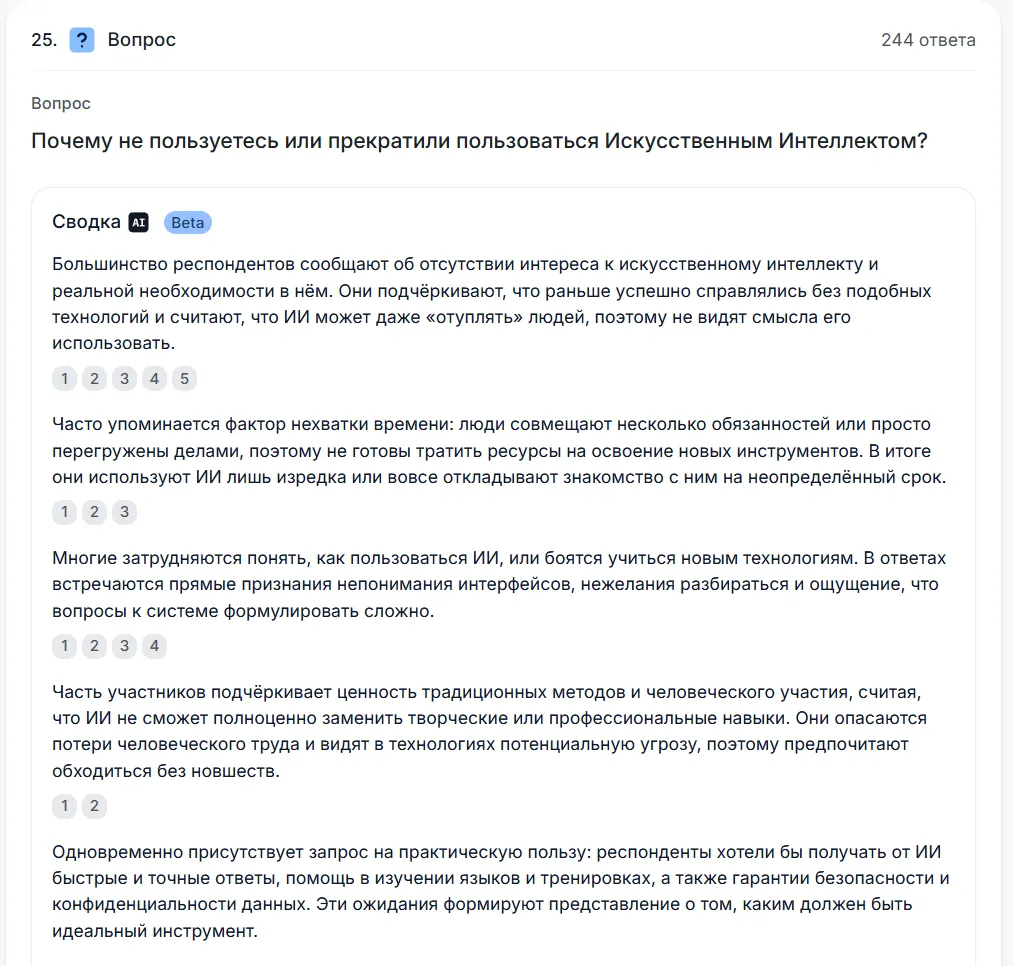
An open question is one of the simplest and at the same time most difficult ways to get information. It helps:
- In surveys, when the topic is new and you do not yet know how to classify possible answers.
- In tests, to learn after a scenario how a person explains their actions, impressions, or difficulties.

The difficulty is that respondents quickly get tired of writing detailed answers. Use open questions selectively — only where it is truly important to hear the user’s “live voice.”
What to consider when using the method
- Do not overload respondents: 1–2 open questions per study are enough.
- Place the open question at the end of the block, after the main choice or rating.
- Ask for an example: this adds specificity and helps interpretation.
What results you will get:
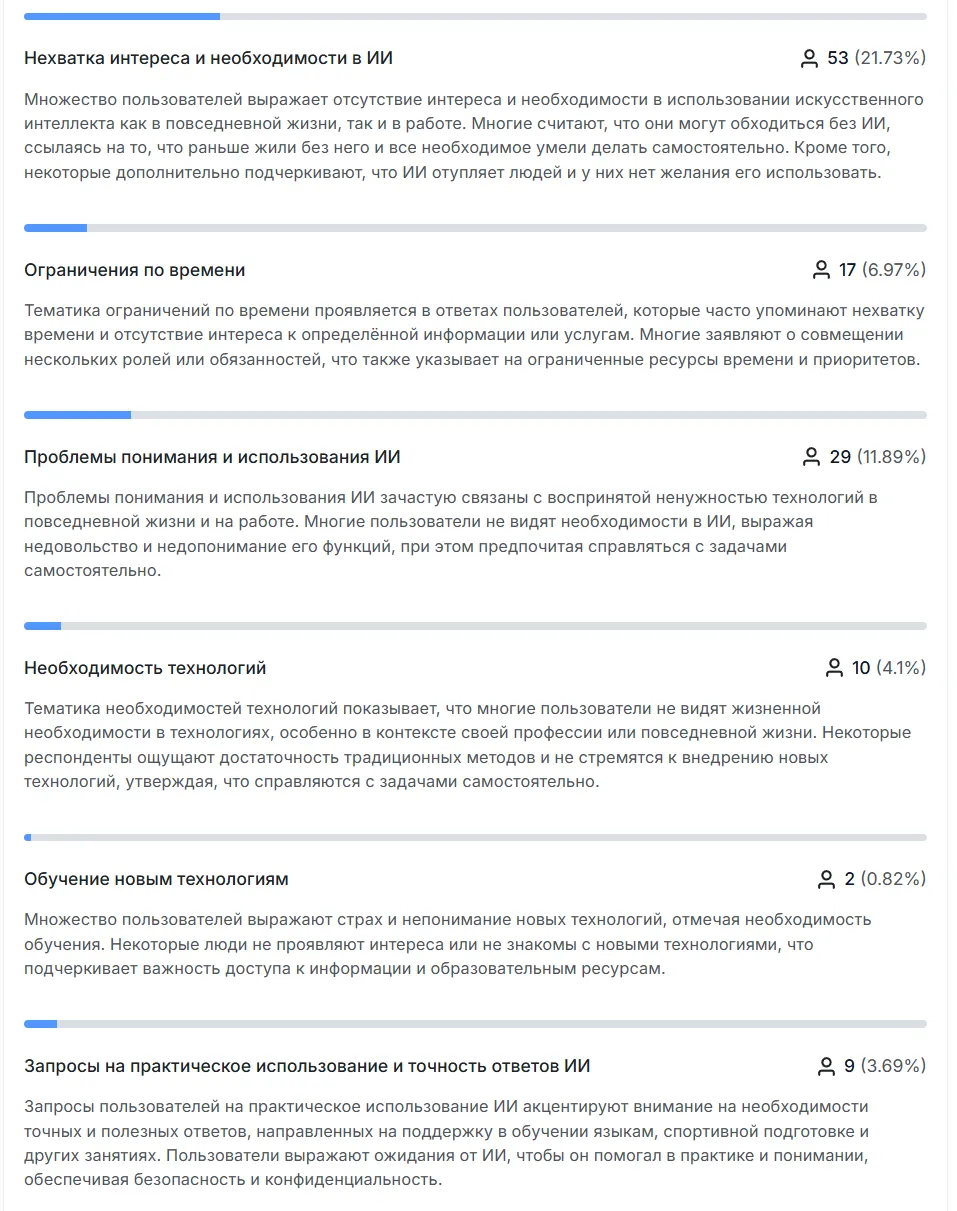
- Text answers from which you can identify themes, patterns, and insights.
Multiple choice
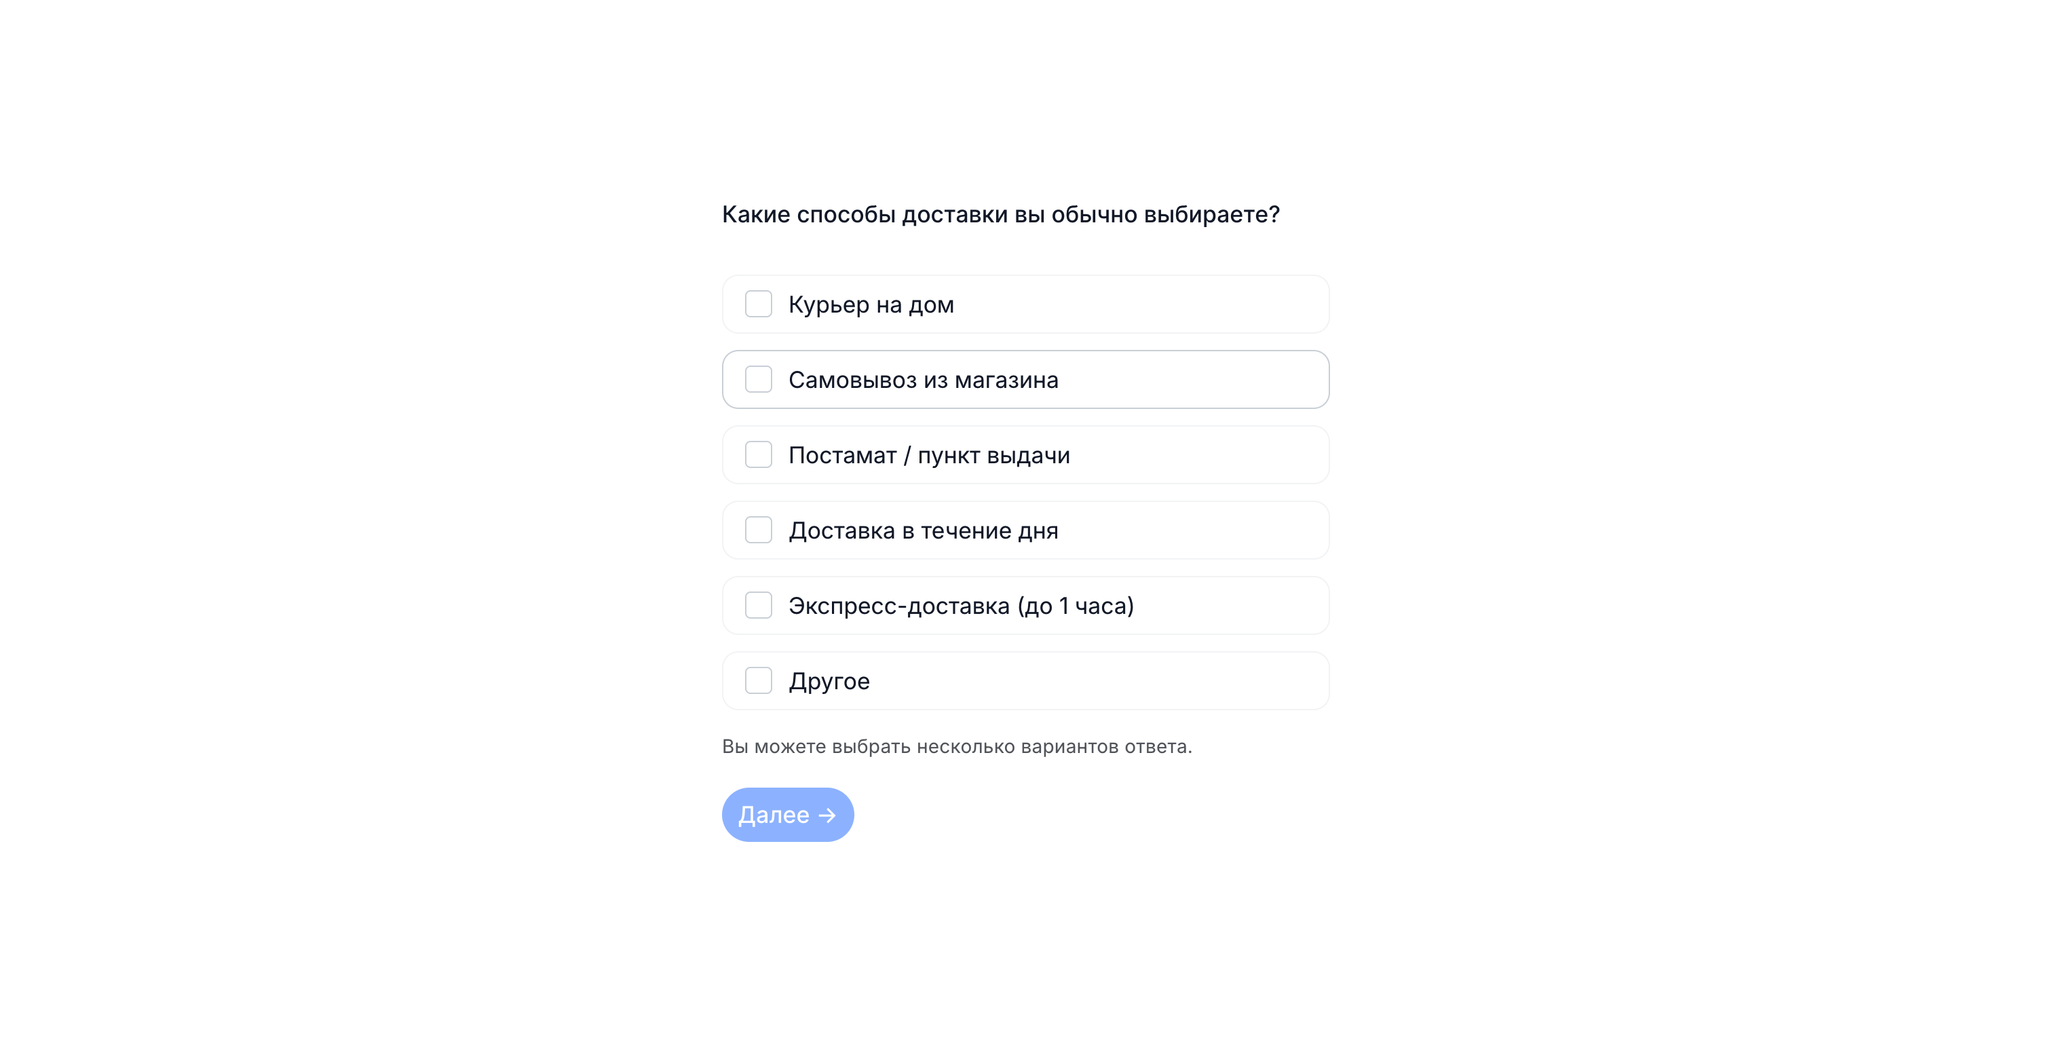
The respondent is given a question with several answer options. They can choose several that apply to them. The method helps understand which options are truly meaningful and what the choice is based on, for example:
✔︎ Which payment or delivery methods are used most often. ✔︎ Which communication channels are considered convenient: email, messengers, calls. ✔︎ Which barriers and difficulties occur more often than others. ✔︎ Which information sources help people decide about a product or service.
What to consider when using the method:
- Options should be clear and not overlap with each other.
- Do not use multiple choice without a qualitative base: first collect options through interviews, desk research, or open questions, and only then validate them in a closed list.
- Avoid overly long lists: 6–10 items is optimal. If there are more than 12–15 options, group them or use filters, for example first category selection, then clarification.
- For sensitive topics, such as income or health, phrase questions carefully and add a “Prefer not to answer” option.
- Use an “Other” option so the respondent does not get stuck if they cannot find a suitable answer.
What results you will get:
- Quantitative distribution across options.
- Comments in the “Other” option.
Additional settings: when and why to use them
These settings help make surveys and tests more comfortable for respondents and more accurate for you. Below is a short overview of how and when to use each setting.
Optional question. The respondent can skip it if they do not have experience or are not ready to answer.
- Suitable for sensitive topics: income, health, family status.
- When a person may not know what the question refers to — for example, “night delivery.”
- If there are too many optional questions, the answers will be incomplete.
Allow selecting multiple options. Use this when the respondent may have several correct answers. This makes the data fuller and closer to real experience.
Shuffle answer order. If the list has logic, for example “18–24,” “25–34,” keep the order. If there is no logic, enable shuffling. This helps:
- Reduce position bias: frequent selection of the first items
- Prevent mechanical answers
- Improve data accuracy
What results you can generally get from unmoderated research
Which indicators you need depends on the task and the research question.
Success rate
Define task success and an acceptable outcome for the scenario before testing. Report how many participants succeeded, how many attempted the task, and where they struggled.
Efficiency
How much time a person needs to complete the task. In scenario tests, a long time points to difficulties completing scenarios.

Problems
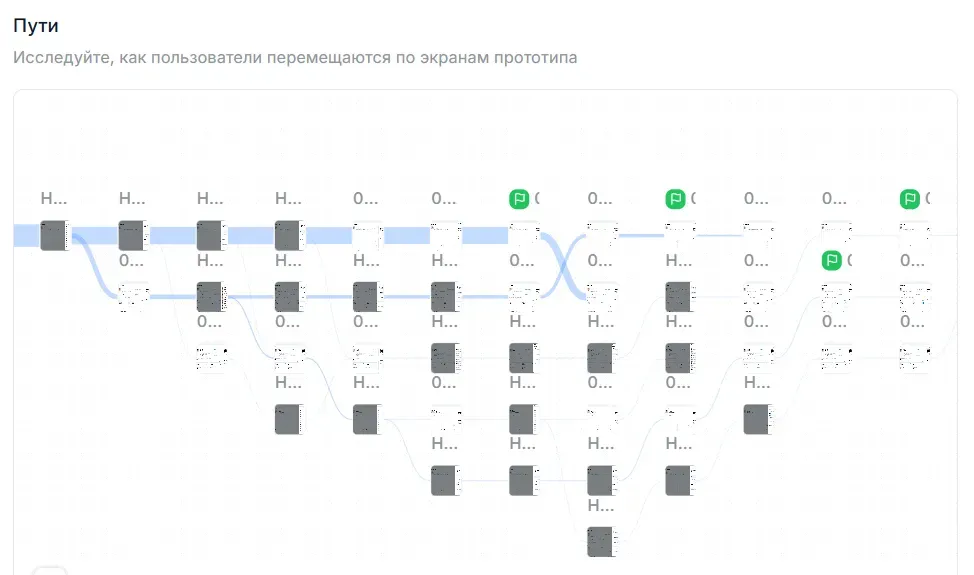
If users did not complete the task or spent a lot of time, you need to analyze the reasons — the problems they encountered. Path analysis and video review will help.
Feature memorability
Within one test, you can check how well users remember how to use a feature. First ask them to complete the scenario of turning the feature on, and after some time — the scenario of turning it off, to compare how quickly and confidently participants handle the task.
Satisfaction
Experience, opinion, and attitude
With multiple-choice questions, scales, matrices, and open fields, you can learn how people perceive the product, evaluate the experience, and relate to different solutions.
Checklist for checking tasks and questions in unmoderated research
Use this checklist to quickly make sure tasks are clear to respondents. Below you can read more about each point and see examples.
Add context before the task. Without a couple of lines about the situation, a person will not understand what to look for and why. Their behavior will be random.

One idea in one question. Do not combine two questions into one — the respondent will answer only part of it or get confused.
Keep wording short. Long and overloaded phrases make perception harder and make respondents lose their place.
Use real scenarios. Tasks should sound like familiar human actions, not like interface descriptions.
Avoid unrealistic roles. Do not place people in situations far from their experience — this reduces the reliability of results.
Minimize open questions. In unmoderated tests, open answers provide less data and are harder to analyze. It is better to use scales or answer options.
Do not name interface elements. If you mention a button or link by name, the person will start looking for exactly that element rather than solving the task.
Check neutral wording. Questions should not contain evaluative words.